Prerequisites
This guide assumes that:- SSH access and root-level privileges are available to each server running Ocient Software.
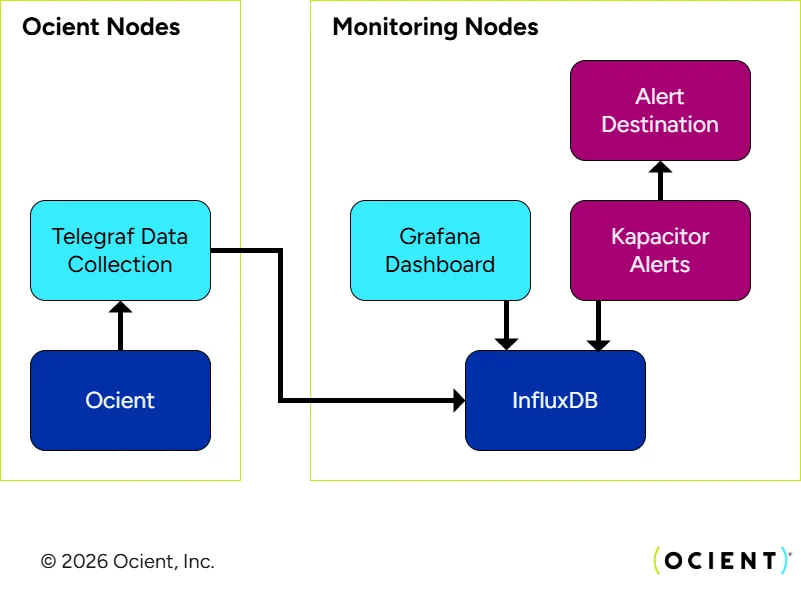
- InfluxDB, Kapacitor, and Grafana are available to be installed in a virtual machine or container. It is important to note that each of these systems should be run independently. For example, do not run InfluxDB, Kapacitor, and Grafana on the same virtual machine.
- All Ocient software is currently deployed and running as expected.
- Logging configuration is set up as specified in Log Configuration.
- The following ports must be open for InfluxDB, Kapacitor, Telegraf, and Grafana. InfluxDB is the most critical as each component communicates with it. Always refer to the latest documentation for each product as the definitive reference.
Step 1: Deploy InfluxDB
InfluxDB is a timeseries database that provides persistence for the host-level and Ocient software metrics. 1. Refer to current instructions from InfluxDB on how to install the service: https://docs.influxdata.com/influxdb/v2.0/install/ https://docs.influxdata.com/influxdb/v2.0/get-started/ 2. Document the IP address of the machine where InfluxDB is installed. 3. Ensure that InfluxDB is running properly.Shell
Shell
Step 2: Deploy and Configure Telegraf
Telegraf is used for metrics collection. It runs on each of the Admin, Loader, Foundation, SQL Nodes. The following instructions highlight the common configuration elements, followed by the elements that are specific to different node types.All Nodes
1. Install Telegraf on each of the Admin, Loader, Foundation, and SQL Nodes. Refer to the Telegraf installation instructions available from InfluxDB. At this point, do not start the Telegraf service or generate the default configuration. 2. For all nodes, create the Telegraf configuration file (typically located at/etc/telegraf/telegraf.conf). Open the file in an editor.
- Copy and paste the following contents into the file.
- Replace the designated placeholders (denoted with a $) with the specific values for the specified environment:
CLUSTER_NAME =— Customer-selected name of a provided cluster for monitoring identificationROLE =— One ofadmin,loader,lts,sql, orstream_proc, depending on the node typeINFLUX_URL =— URL of the InfluxDB instance (e.g.,http://10.6.0.4:8086)
Text
/etc/telegraf/telegraf.d) named host.conf.
- Copy and paste the following contents into the file.
- Replace the designated placeholders (denoted with an
$) with the specific values for the specified environment:BOOT_DISK— Device name of the boot disk (e.g.,sda). You can determine the boot disk by running anlsblkcommand.NET_INT_BOND0_WILDCARD— The wildcard for matching the underlying network interfaces withinbond0(e.g.,eno*). If it is unclear, refer to/proc/net/bonding/bond0and reference the interfaces noted in the Telegraf documentation.NET_INT_BOND1_WILDCARD— The wildcard for matching the underlying network interfaces withinbond1(e.g.,enp*). If it is unclear, refer to/proc/net/bonding/bond1and reference the interfaces noted in the Telegraf documentation.
Text
/etc/telegraf/scripts) named uio_pci_generic.sh.
- Copy and paste the following contents into the file.
Shell
Foundation and SQL Nodes
Create a new file under thetelegraf.d directory (typically /etc/telegraf/telegraf.d) named rolehostd.conf.
- Copy and paste the following contents into the file.
- Replace the designated placeholders (denoted with an $) with the specific values for the specified environment:
NODE_BOND0_IP_ADDRESS =IP address associated with bond0
Text
query.json file to a monitoring platform of your choice.
Admin and Loader Nodes
Create a new file under thetelegraf.d directory (typically /etc/telegraf/telegraf.d) named rolehostd.conf.
- Copy and paste the following contents into the file.
- Replace the designated placeholders (denoted with an $) with the specific values for the specified environment:
NODE_BOND0_IP_ADDRESS =IP address associated with bond0
Text
Loader Nodes
Loader Nodes also run the Loading and Transformation service and require additional Telegraf configuration to capture those metrics.- Create a new file under the
telegraf.ddirectory (typically/etc/telegraf/telegraf.d) namedlat.conf. - Copy and paste the following contents into the file.
Text
Start Telegraf
When the configuration is properly entered on all nodes, Telegraf must be started. 1. On each node, start the Telegraf service.Shell
Shell
Shell
Step 3: Deploy and Configure Kapacitor
Kapacitor is used to process time series data, detect anomalies, and trigger alerts. As the preferred alerting mechanisms for every customer will vary, refer to the Kapacitor documentation on how to send alerts through specific tools. 1. Install Kapacitor using the instructions from InfluxDB. https://docs.influxdata.com/kapacitor/v1.6/introduction/installation/ 2. Create the Kapacitor configuration file (typically located at/etc/kapacitor/kapacitor.conf).
Open the file in an editor.
- Copy and paste the following contents into the file.
- Replace the designated placeholders (denoted with an $) with the specific values for the specified environment:
KAPACITOR_HOST_OR_IP =— Hostname or IP address associated with the Kapacitor instanceINFLUX_URL =— URL of the InfluxDB instance (e.g.,http://10.6.0.4:8086)
Text
Add Kapacitor Alerts and Templates
Ocient provides sample Kapacitor alerts and templates upon request. Contact Ocient Support for details. Within the bundle, relevant contents are located within thekapacitor directory.
- Copy the files located under
kapacitor/load/tasksto the Kapacitor system in/etc/kapacitor/load/tasks. - Copy the files located under
kapacitor/load/templatesto the Kapacitor system in/etc/kapacitor/load/templates.
Start Kapacitor
When the configuration is complete, Kapacitor must be started. 1. On each node, start the Kapacitor service.Shell
Shell
Shell
Step 4: Deploy and Configure Grafana
Grafana provides the dashboard and visualization capability for metrics. This tool is used as opposed to , which is traditionally used to complete the TICK (Telegraf, InfluxDB, Chronograf, and Kapacitor) stack. Grafana is favored over Chronograf due to its versatility beyond the InfluxDB ecosystem, as well as higher frequency of contributions and updates from the broader community. Install Grafana. Follow the Grafana instructions to ensure that configuration options for items such as users, permissions, and logging all correspond to the environment. https://grafana.com/docs/grafana/latest/installation/Add InfluxDB as a Data Source
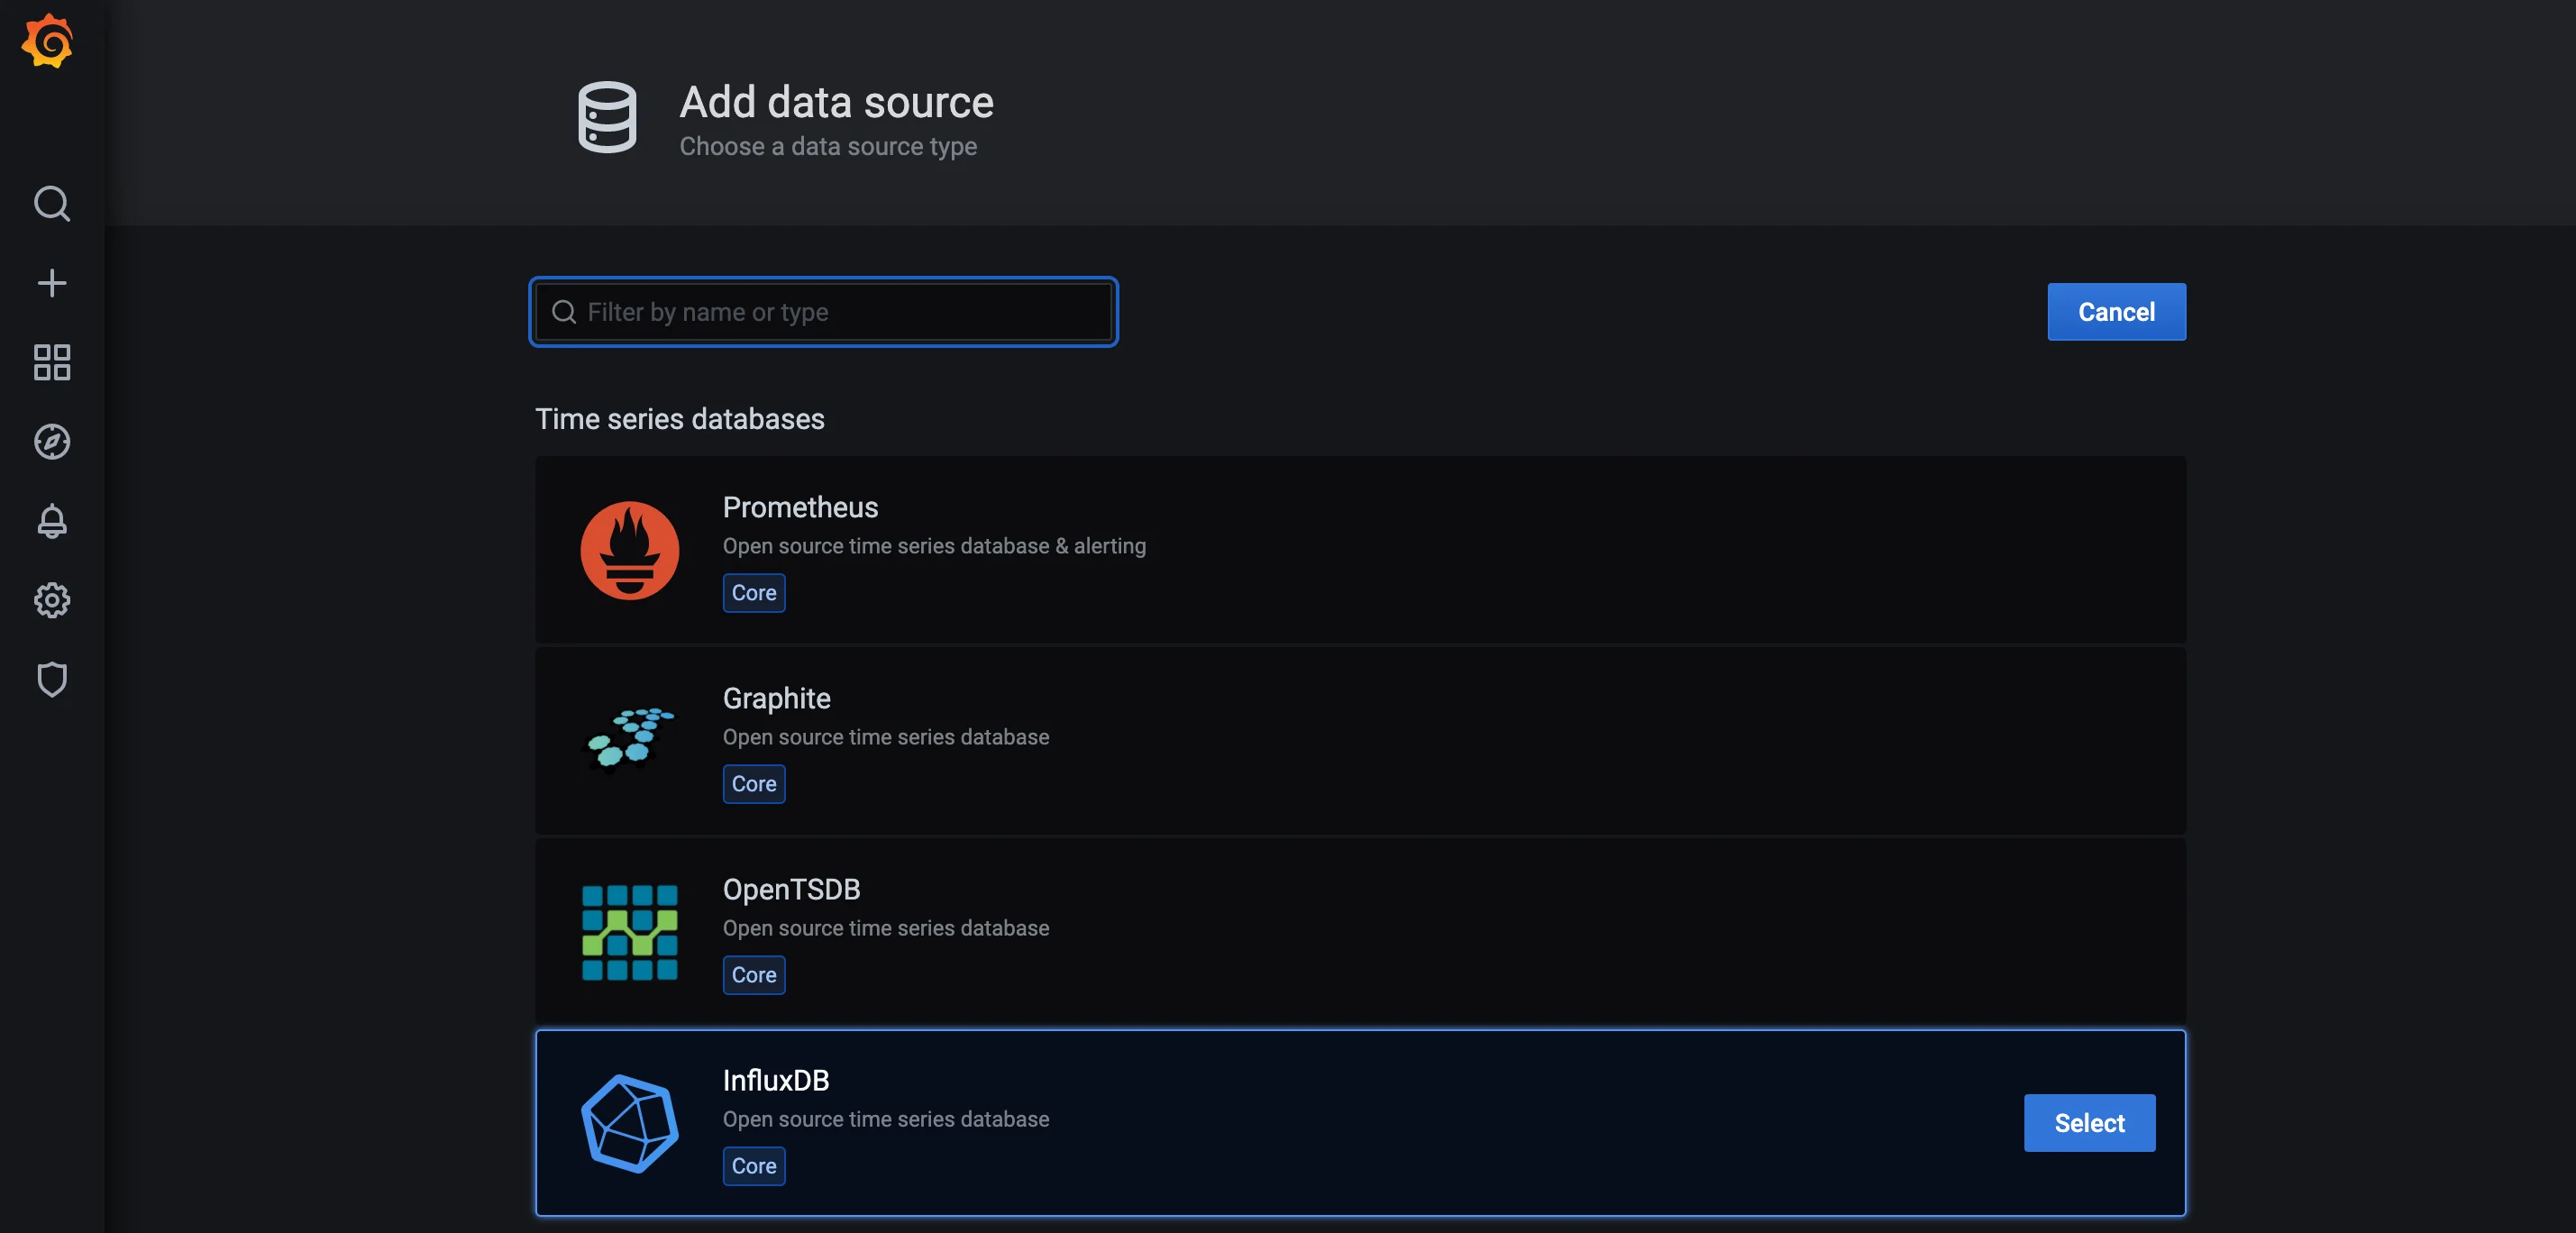
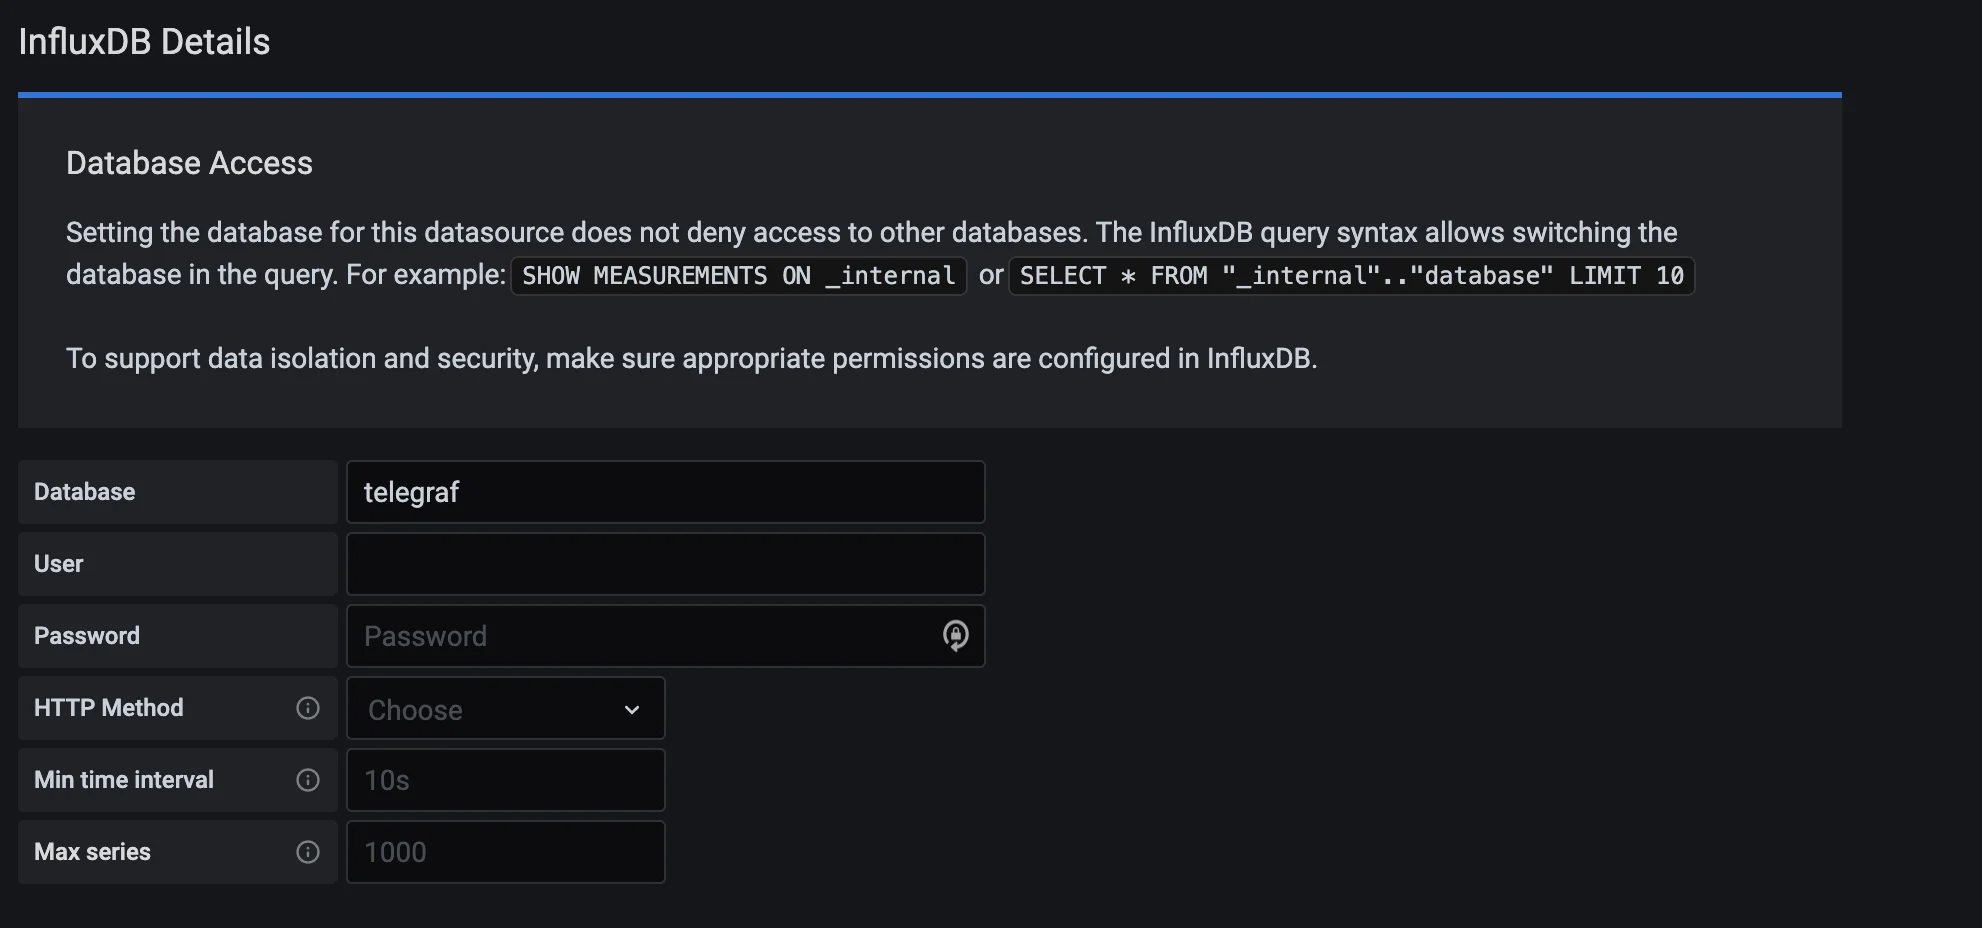
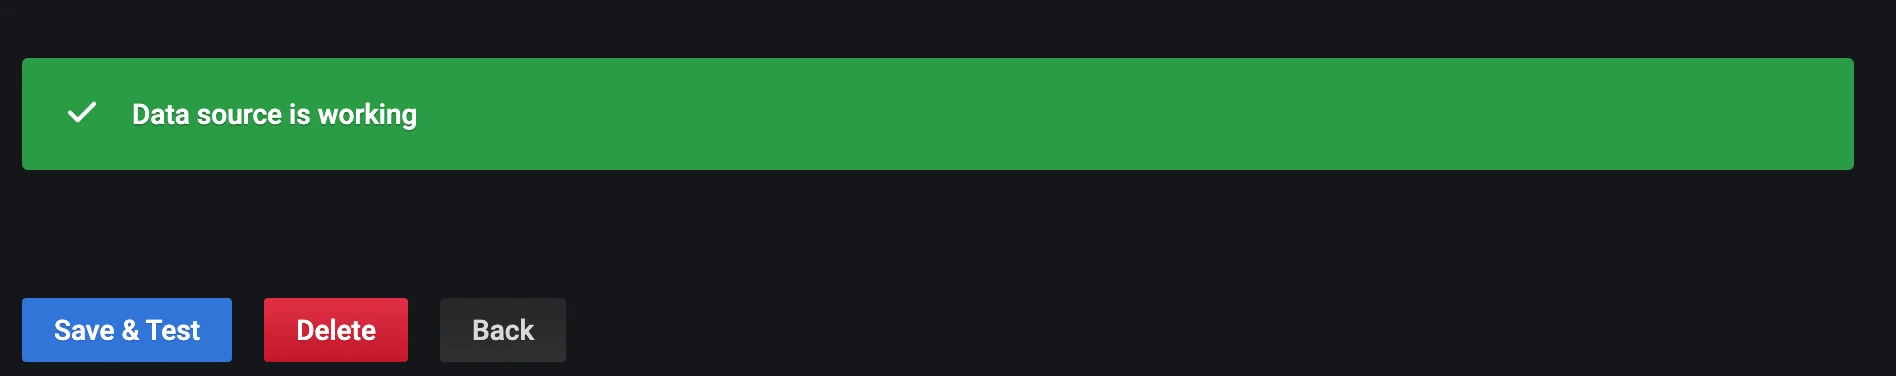
1. Open Grafana in a web browser. 2. In the Grafana UI, select the Settings tab on the left side of the screen. Select Configuration->Data Sources.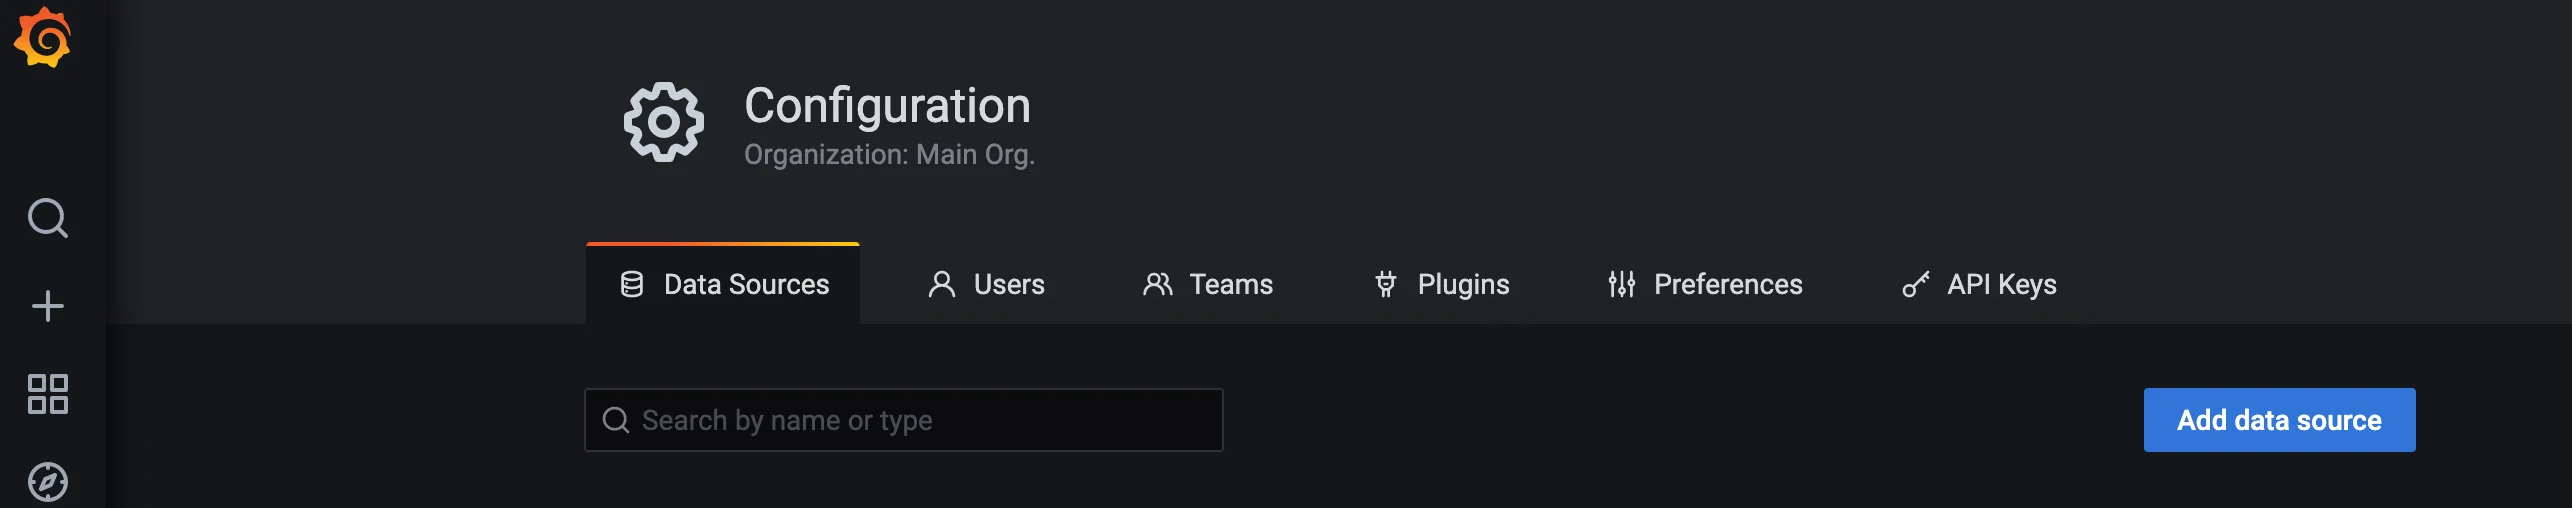
- Ensure the data source is marked as the Default.
- Under the HTTP section, the URL should be the same as the INFLUX_URL used in previous sections.
- The query language should be set to the default (InfluxQL).
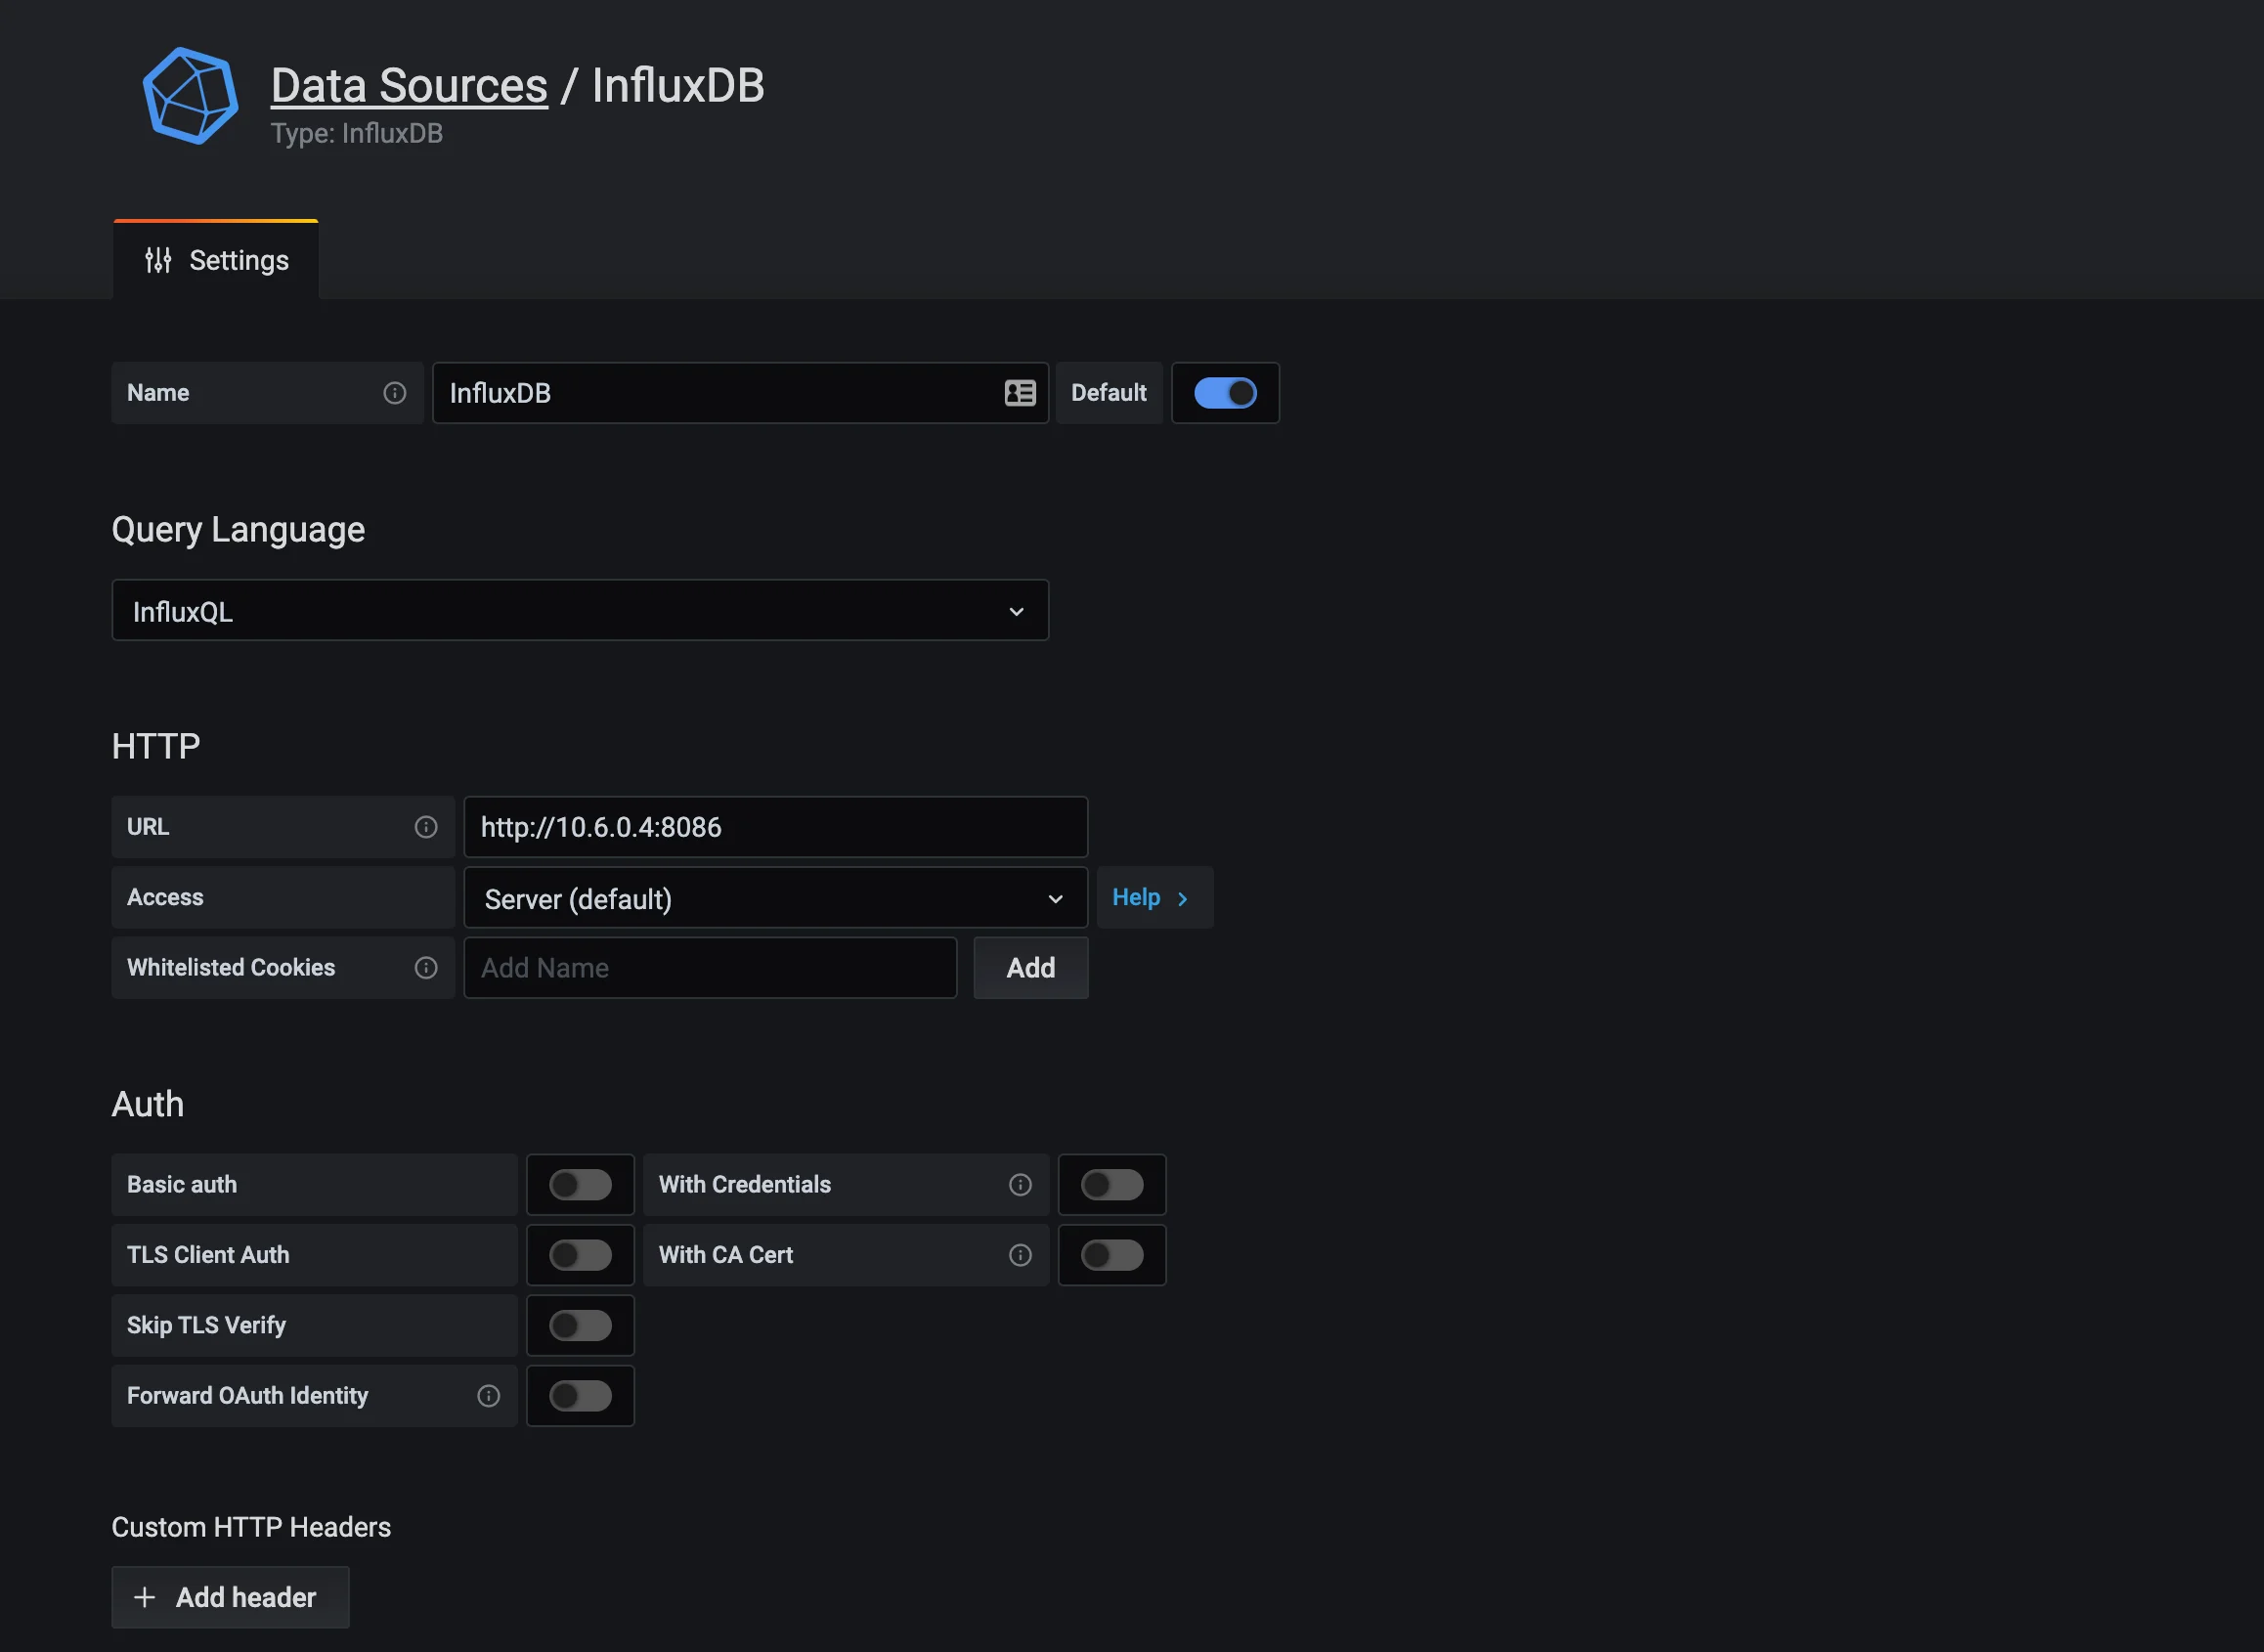
telegraf as the database name.
Import Dashboards
Ocient provides sample Grafana dashboards upon request. Contact Ocient Support for details. Within the bundle, relevant contents are located within thegrafana directory.
Grafana only allows one file at a time.
- Open Grafana in a web browser.
- In the Grafana UI, select the + (“Create”) tab on the left side of the screen. Select the Import option.
- On the Import page, select the Upload JSON File button.
- Select the file representing the dashboard you wish to import.
- On the dashboard summary page, verify the settings are correct. Select Import to complete the process.
- Repeat steps 3-6 for each dashboard that needs to be added.
Related Links
Log Monitoring Statistics MonitoringFilebeat is a trademark of Elasticsearch BV.