
Dashboard
The Dashboard page is the landing page of the Management UI. This page provides a high-level summary of your Ocient System, including storage utilization, total cores, node count, and overall system health. Metric cards summarize query activity, ingestion status, storage utilization, and node health across the system.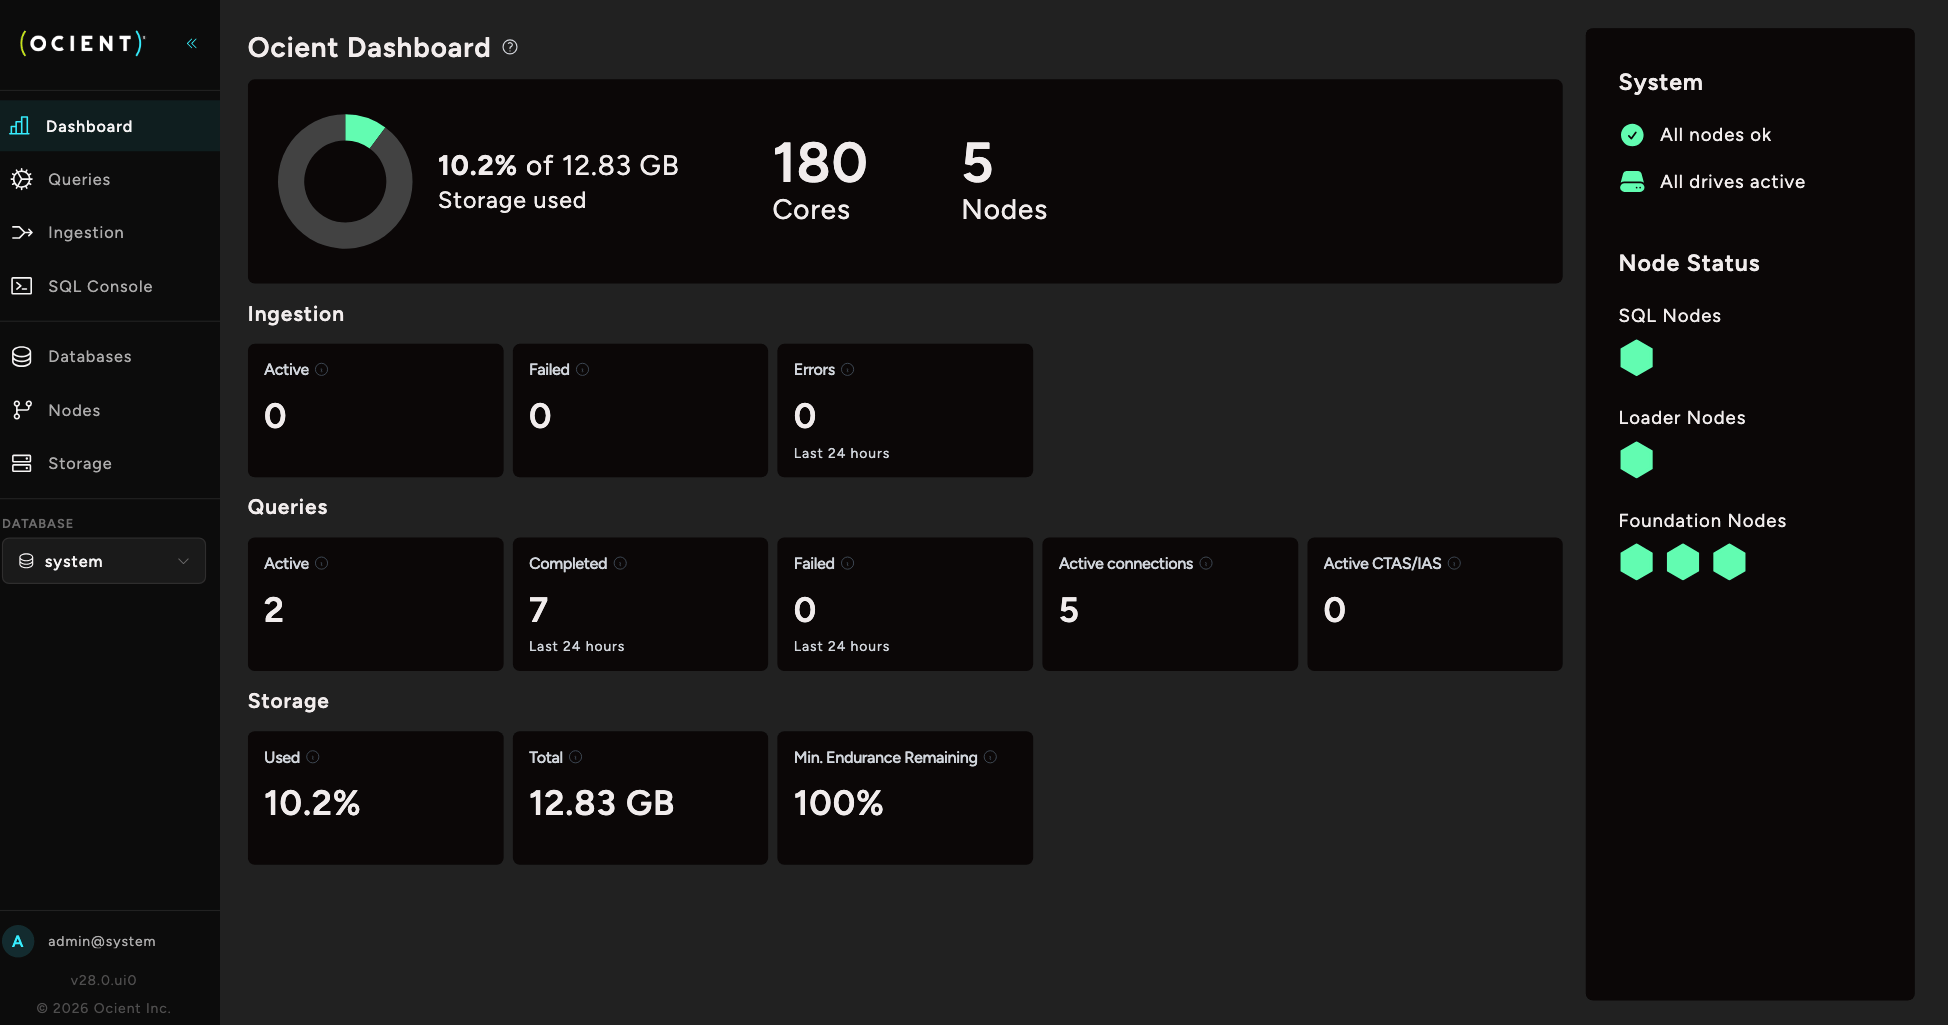
Queries
The Queries page displays a detailed log of all queries executed against the system, including queries that the Management UI itself runs to populate its pages. You can filter queries by text, status, user, service class, and execution time. Each entry shows the start time, query text, return code, status, user, service class, and total execution time. A Concurrency Chart view is available for visualizing query concurrency over time. Select a query to view its full details. For details about query execution and performance, see Query Performance Tuning.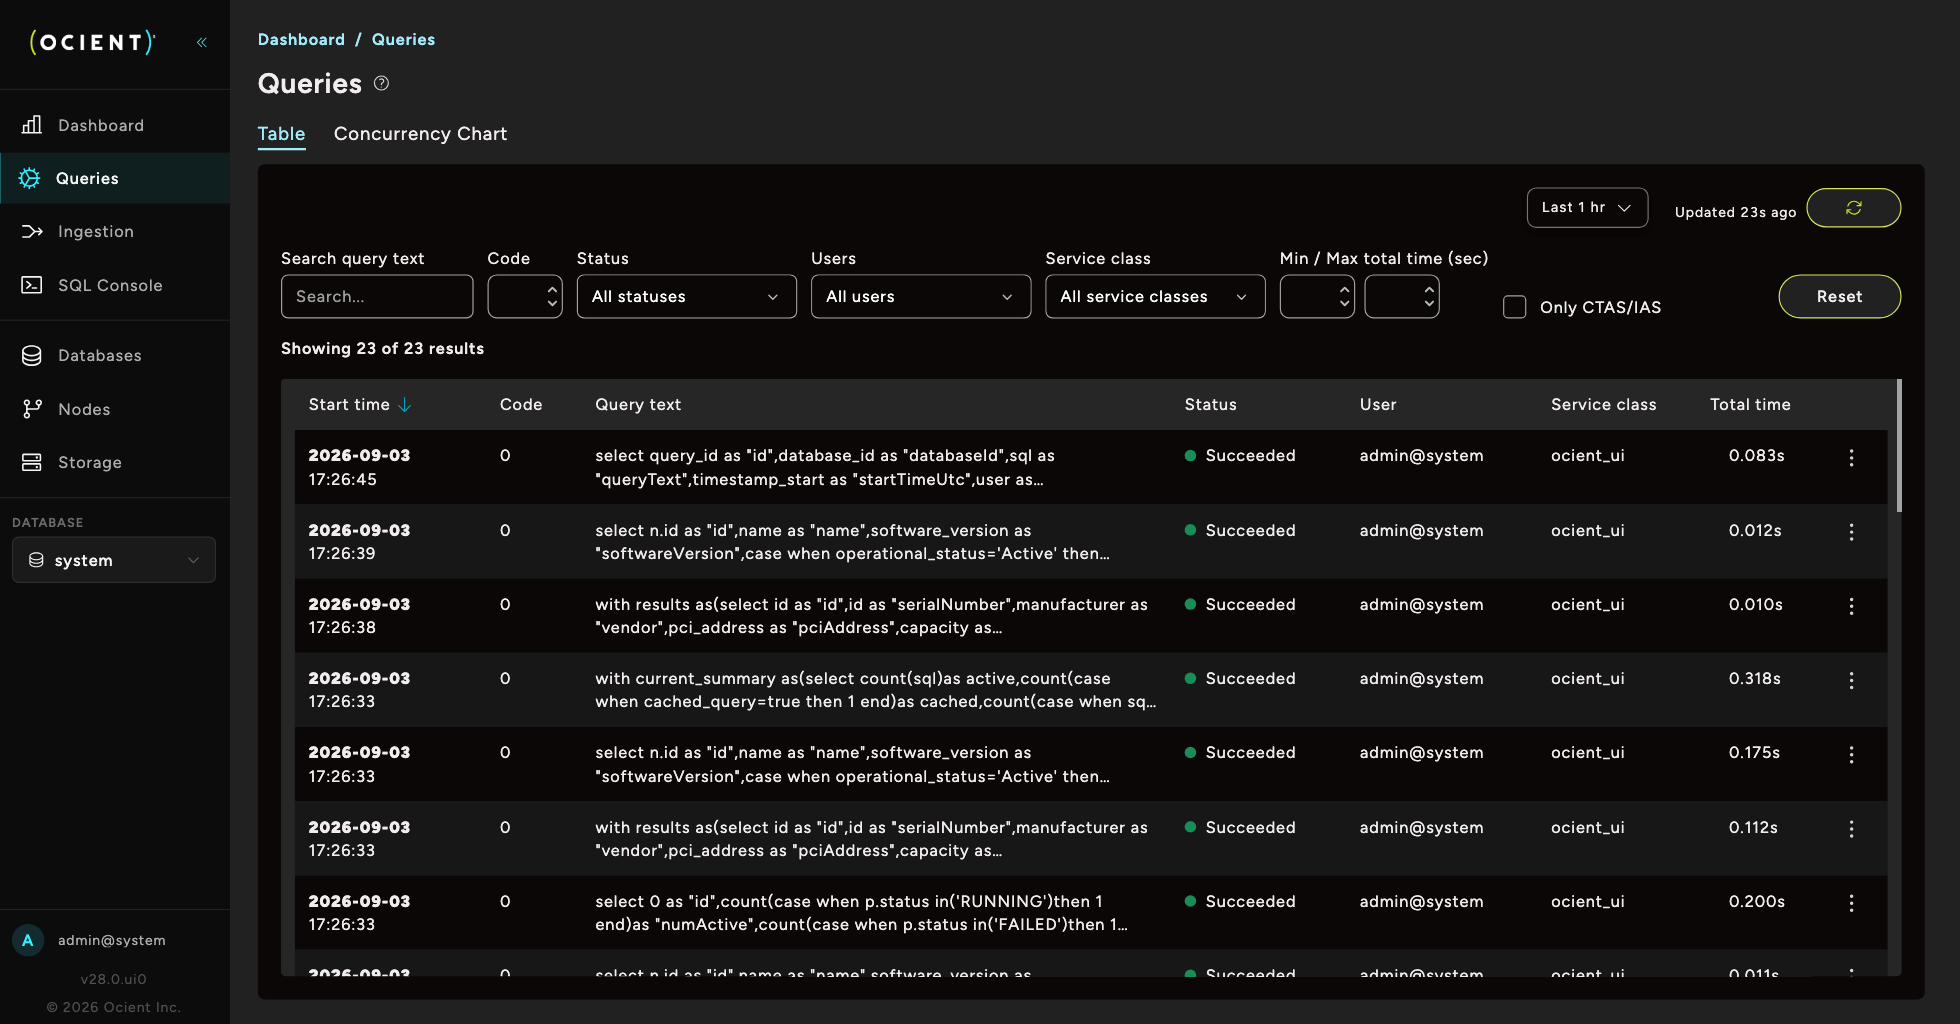
Ingestion
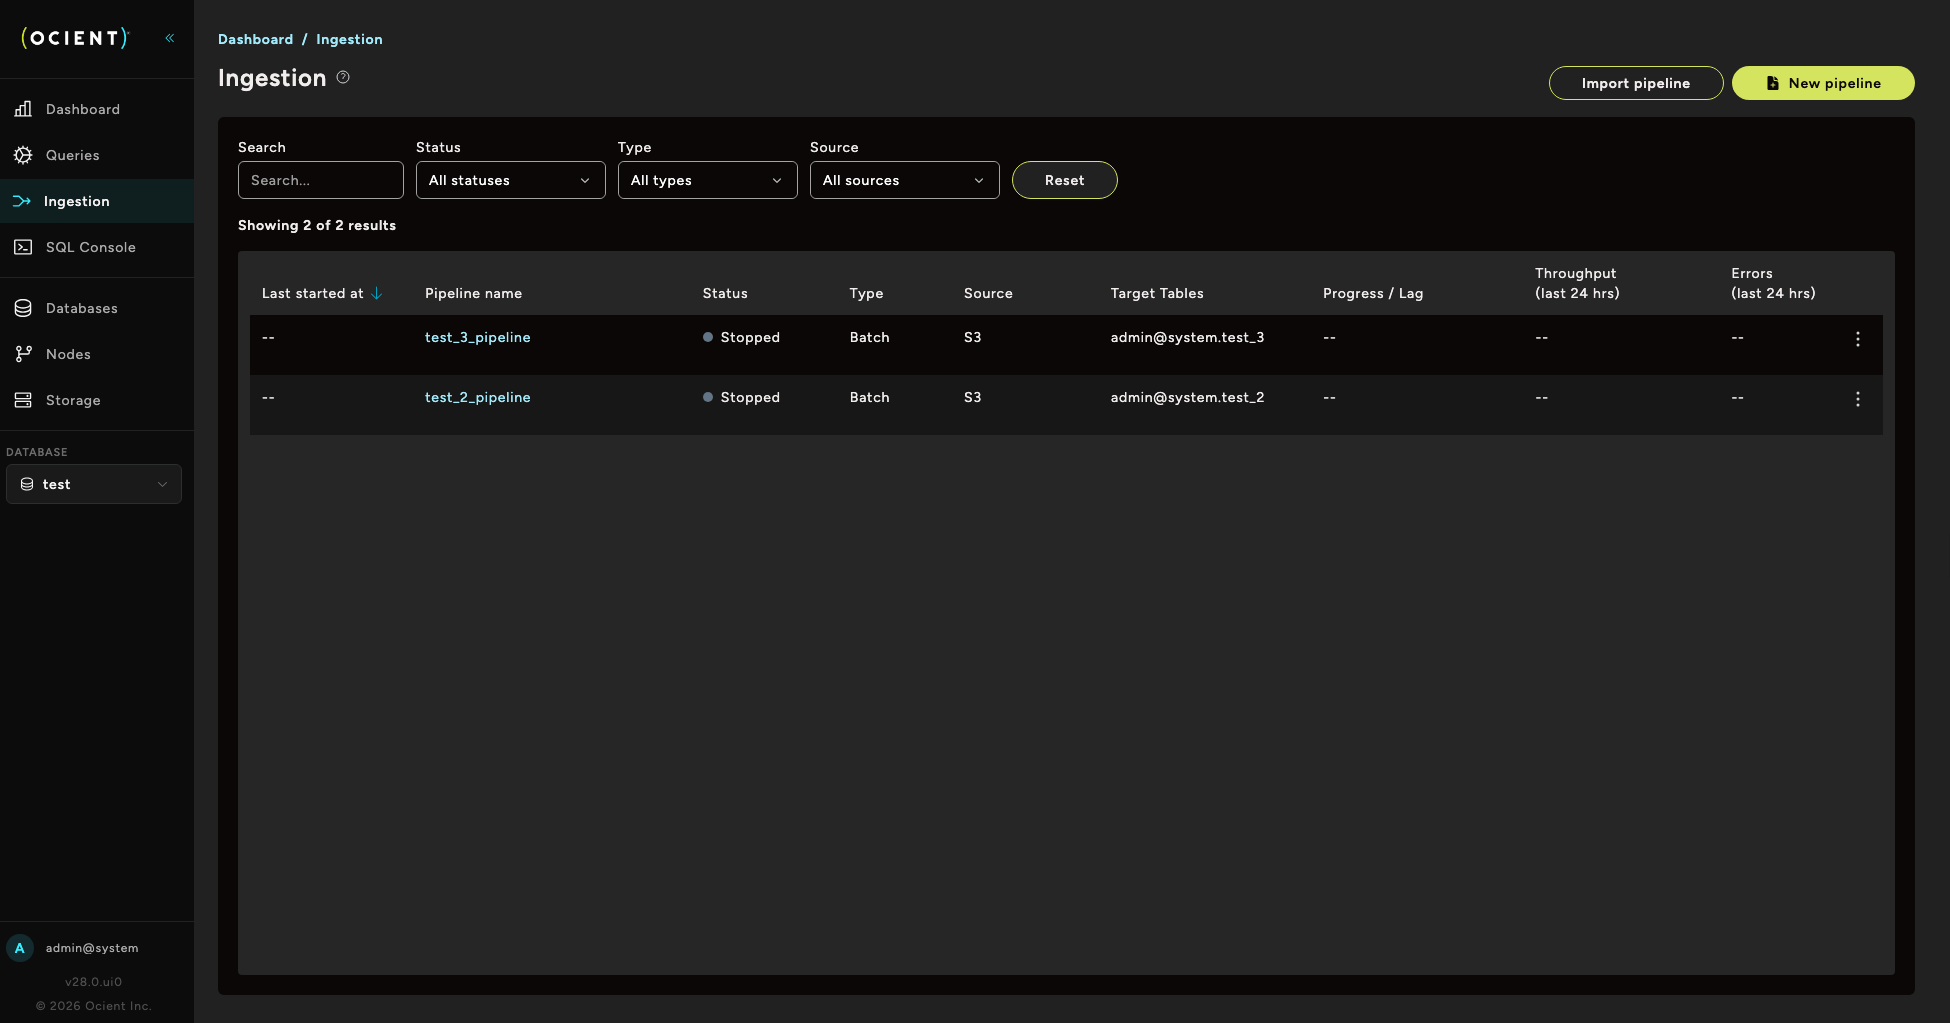
The Ingestion page lists all data pipelines configured on the system. You can search and filter pipelines by status, type, and source. Each pipeline entry displays its start time, name, status, type, source, target tables, progress or lag, throughput, and error count over the last 24 hours. Select Import pipeline to import an existing pipeline definition, or select New pipeline to open the Pipeline Builder and create a new pipeline. To create or import a pipeline, you must select a user database. These options are not available when you connect to thesystem database.
If you have an unsaved draft pipeline from the Pipeline Builder, a draft card appears at the top of the pipeline list. From the draft card action menu, you can click Resume to resume the draft in the Pipeline Builder, click Download to download the pipeline definition, or click Delete to delete the draft. While a draft exists, you cannot create, alter, or duplicate a pipeline because you must resume or delete the draft first. Draft pipelines are user-specific; each user can have one draft at a time.
For details about data pipelines, see Load Data. To learn how to monitor pipeline health and progress, see Monitor Data Pipelines.
Pipeline Builder
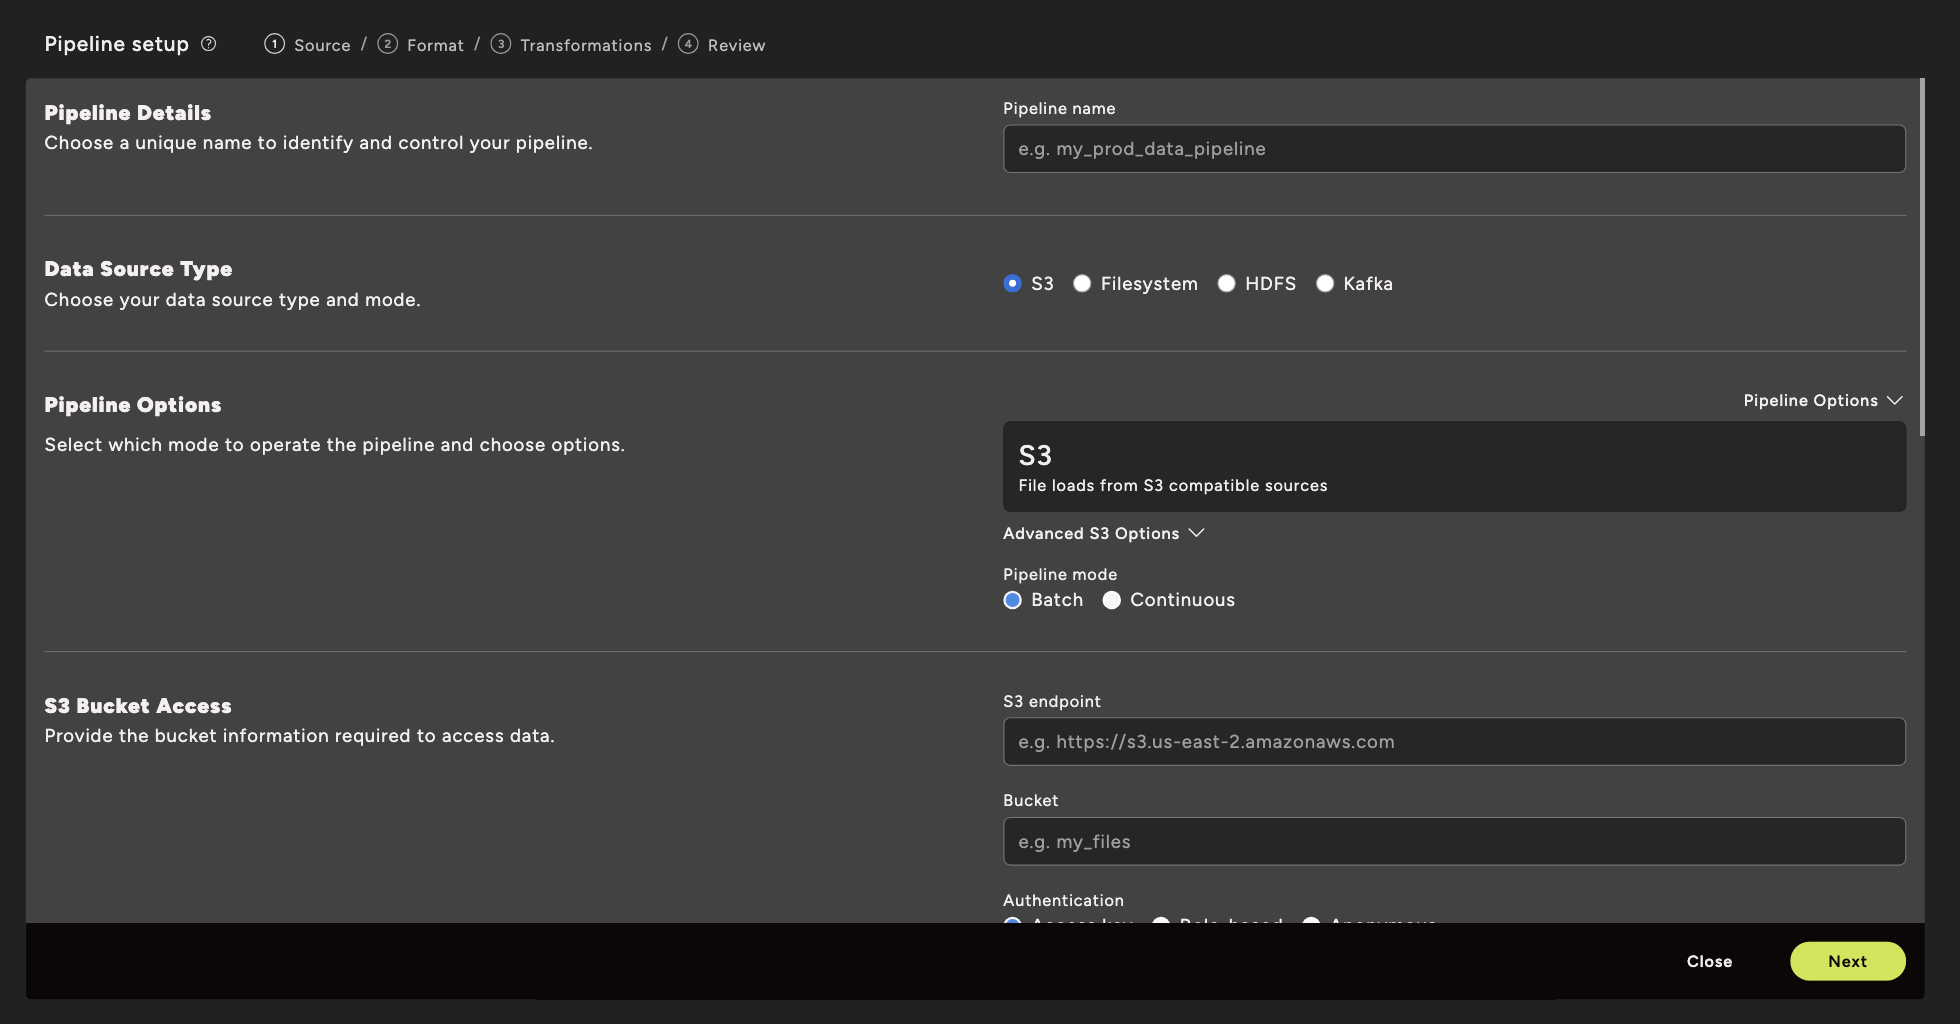
The Pipeline Builder is a guided workflow for creating new data pipelines using the Management UI. To open the Pipeline Builder, select New pipeline on the Ingestion page. You must select a user database in the sidebar.The Pipeline Builder is not available when you connect to the
system database.- Source — Configure the pipeline name, select a data source type (Amazon® Web Services℠ (AWS℠) S3, Filesystem, Apache® Hadoop® Distributed File System (HDFS), or Apache® Kafka®), choose a pipeline mode (Batch or Continuous), and provide connection details.
- Format — Define the data format and parsing options.
- Transformations — Apply any data transformations before loading.
- Review — Review the pipeline configuration before creation.
- Data Pipeline Load of CSV Data from S3
- Data Pipeline Load of JSON Data from Kafka
- Data Pipeline Load of Parquet Data from S3
SQL Console
The SQL Console provides an interactive query editor directly in the browser. You can write and execute SQL statements against the connected database, with results displayed below the editor. The console displays the active database connection and includes a Format SQL option to format your queries. The console caps results at a configurable maximum row count. When the editor contains multiple semicolon-delimited SQL statements, the SQL Console executes only the statement where your cursor is positioned. The console highlights the selected statement to confirm which query executes. To execute a specific statement, place your cursor anywhere within the statement and select Run or press Ctrl+Enter (Windows®/Linux®) or Cmd+Enter (macOS®). If the editor is not focused when you select Run, the console executes all statements in the editor. For an introduction to querying Ocient, see Quick Start Querying.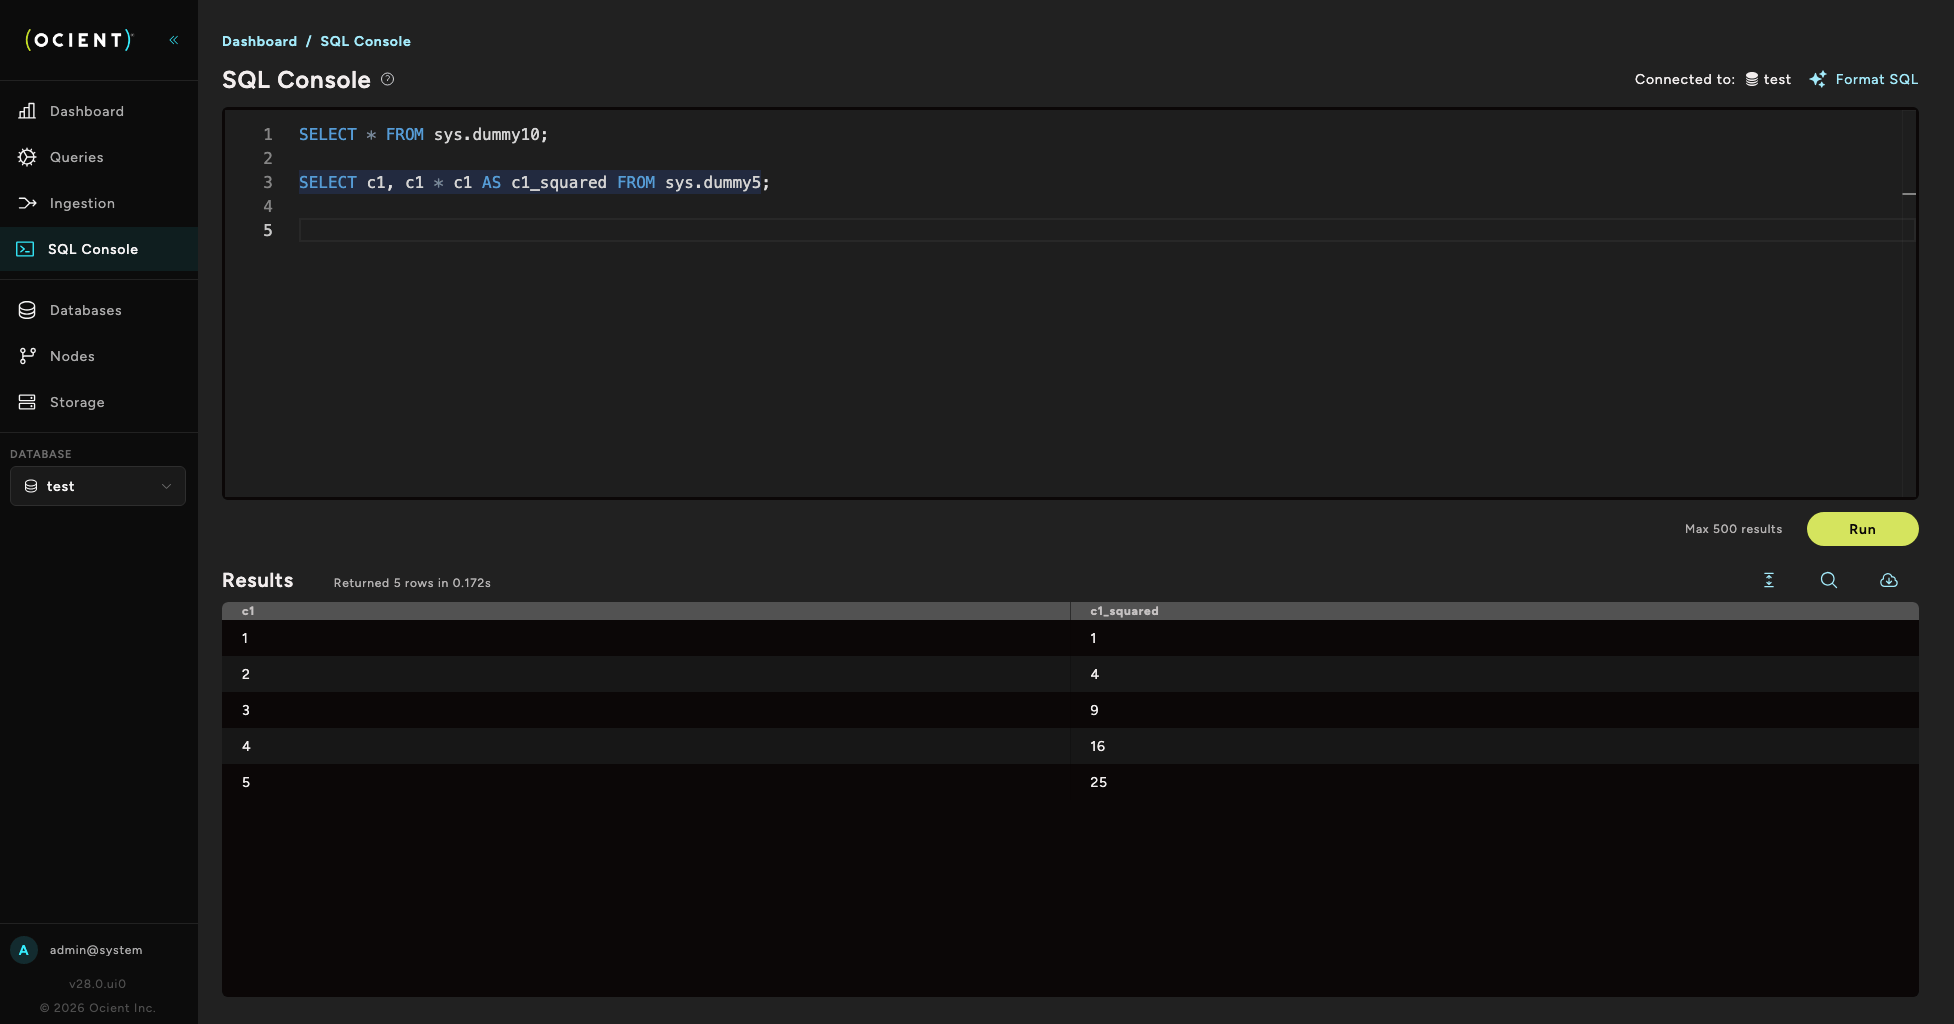
Databases
The Databases page provides an overview of all databases on the system. Summary statistics show total databases, tables, estimated rows, compressed size, and average compression. The table lists each database with its schema count, table count, estimated row count, compressed size, and average compression ratio. Use the dropdown to filter by a specific database. Select a database to view its schemas, select a schema to view its tables, views, and models, and select a table to view its columns, indexes, constraints, and details. You can also view details for a selected schema or database. For details about database management, see Database Administration.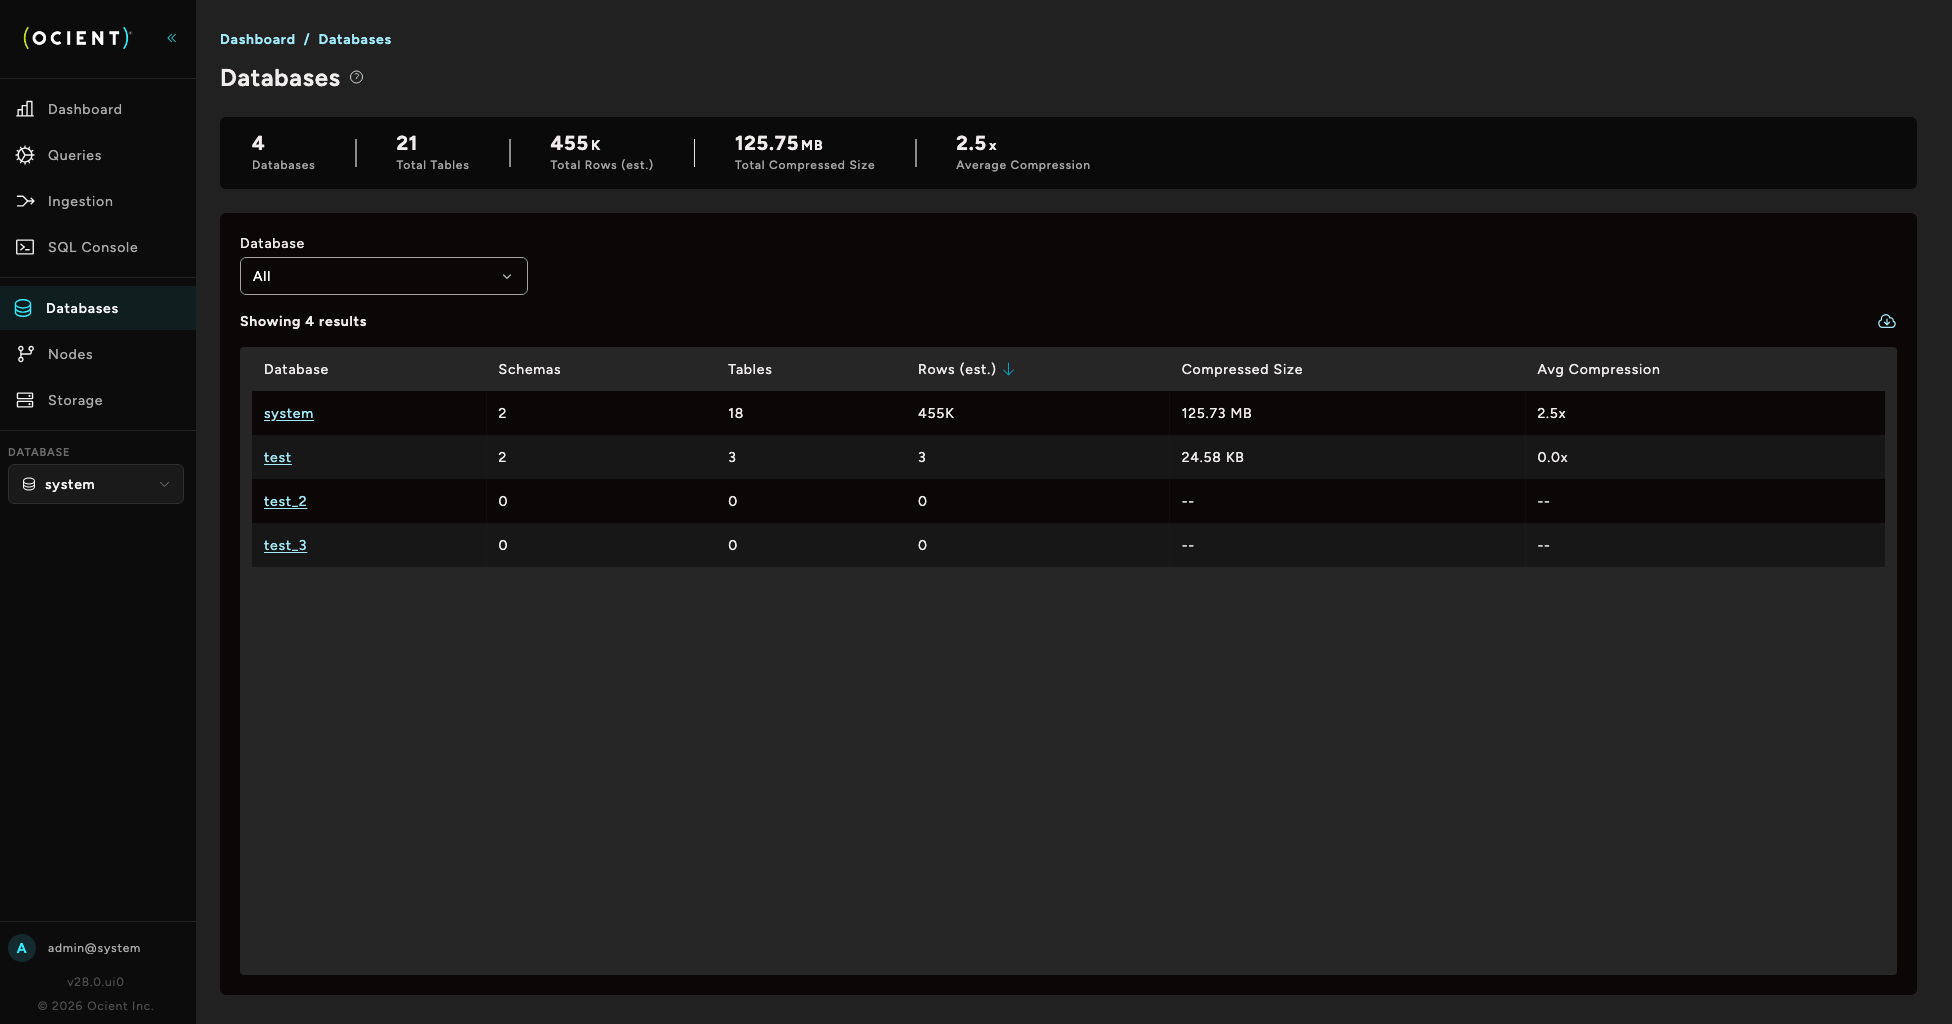
Nodes
The Nodes page shows the health and status of every node in the system. A summary banner displays overall health percentage, total nodes, cores, RAM, drive health, and software version consistency. You can filter nodes by name, type, status, and software version. Each node entry shows its name, type, online status, storage utilization, uptime, and software version. Select a node (from this page or from the Dashboard page) to view its details and configuration. To learn about the role of each node type, see Core Elements of an Ocient System.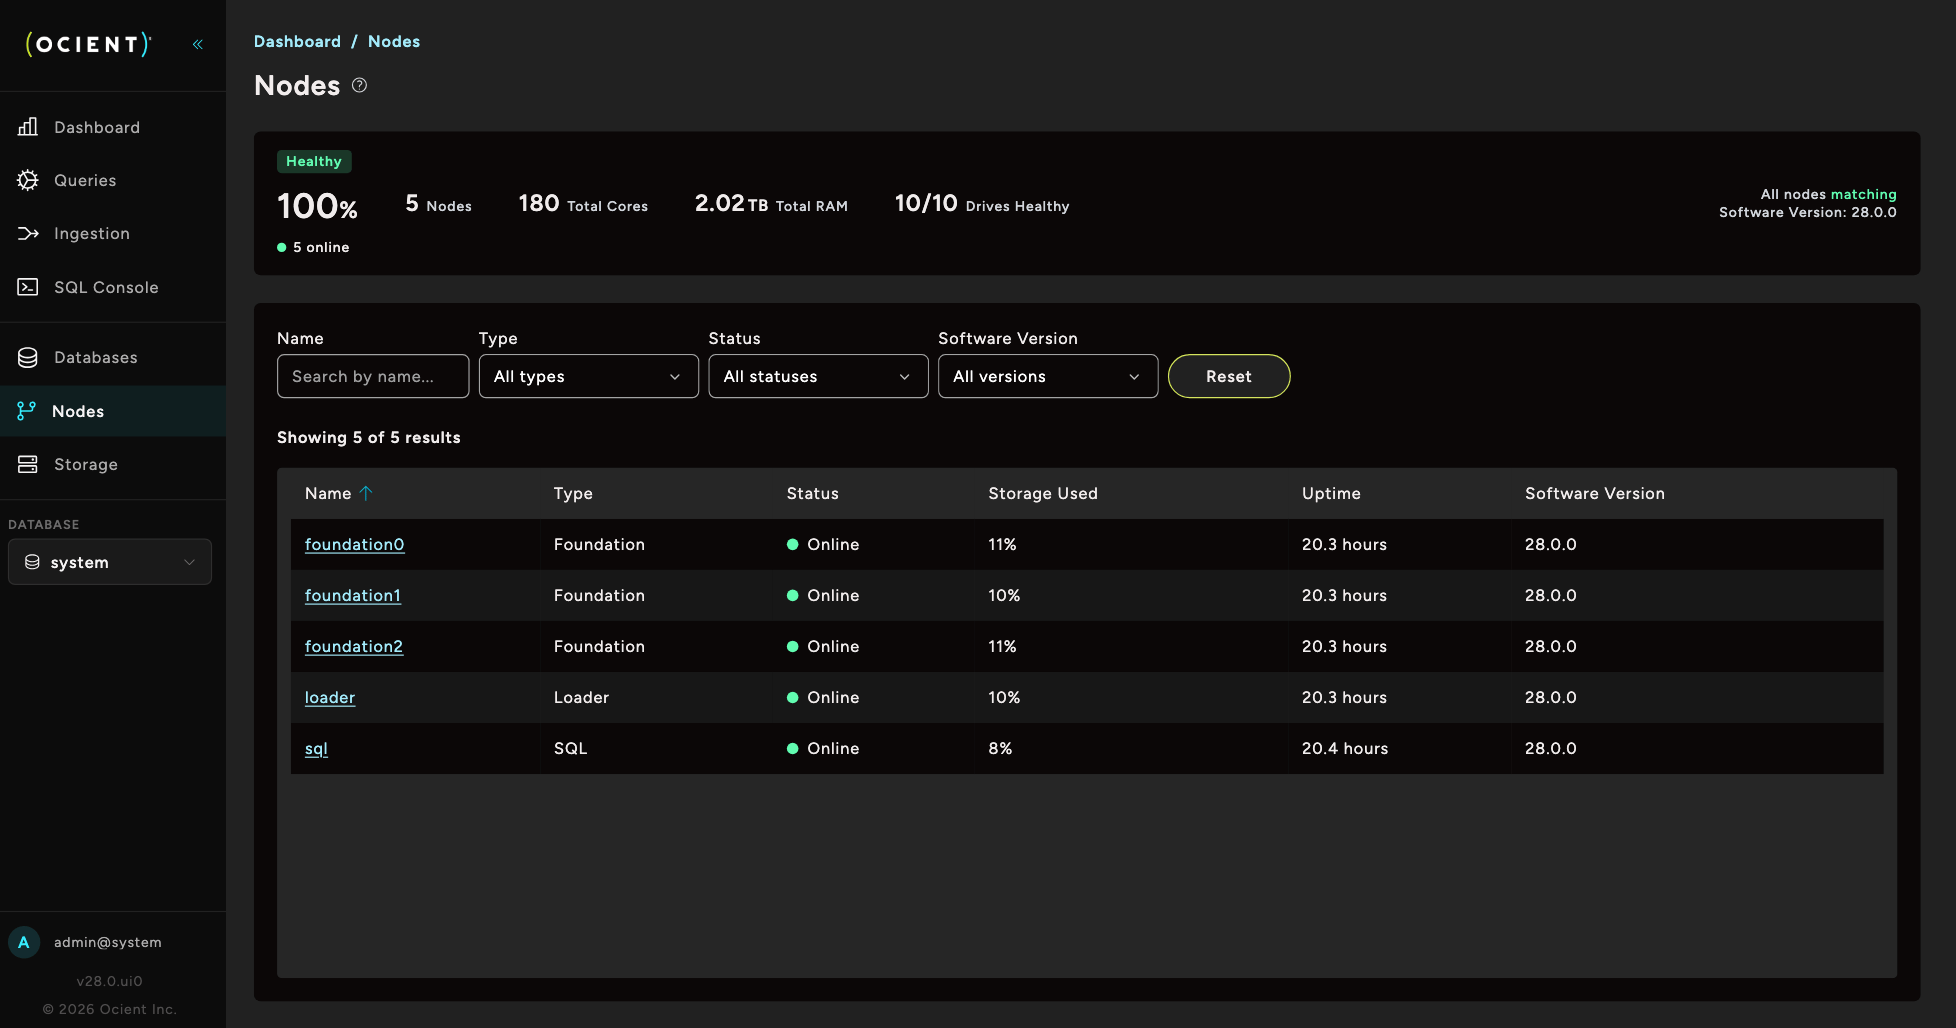
Storage
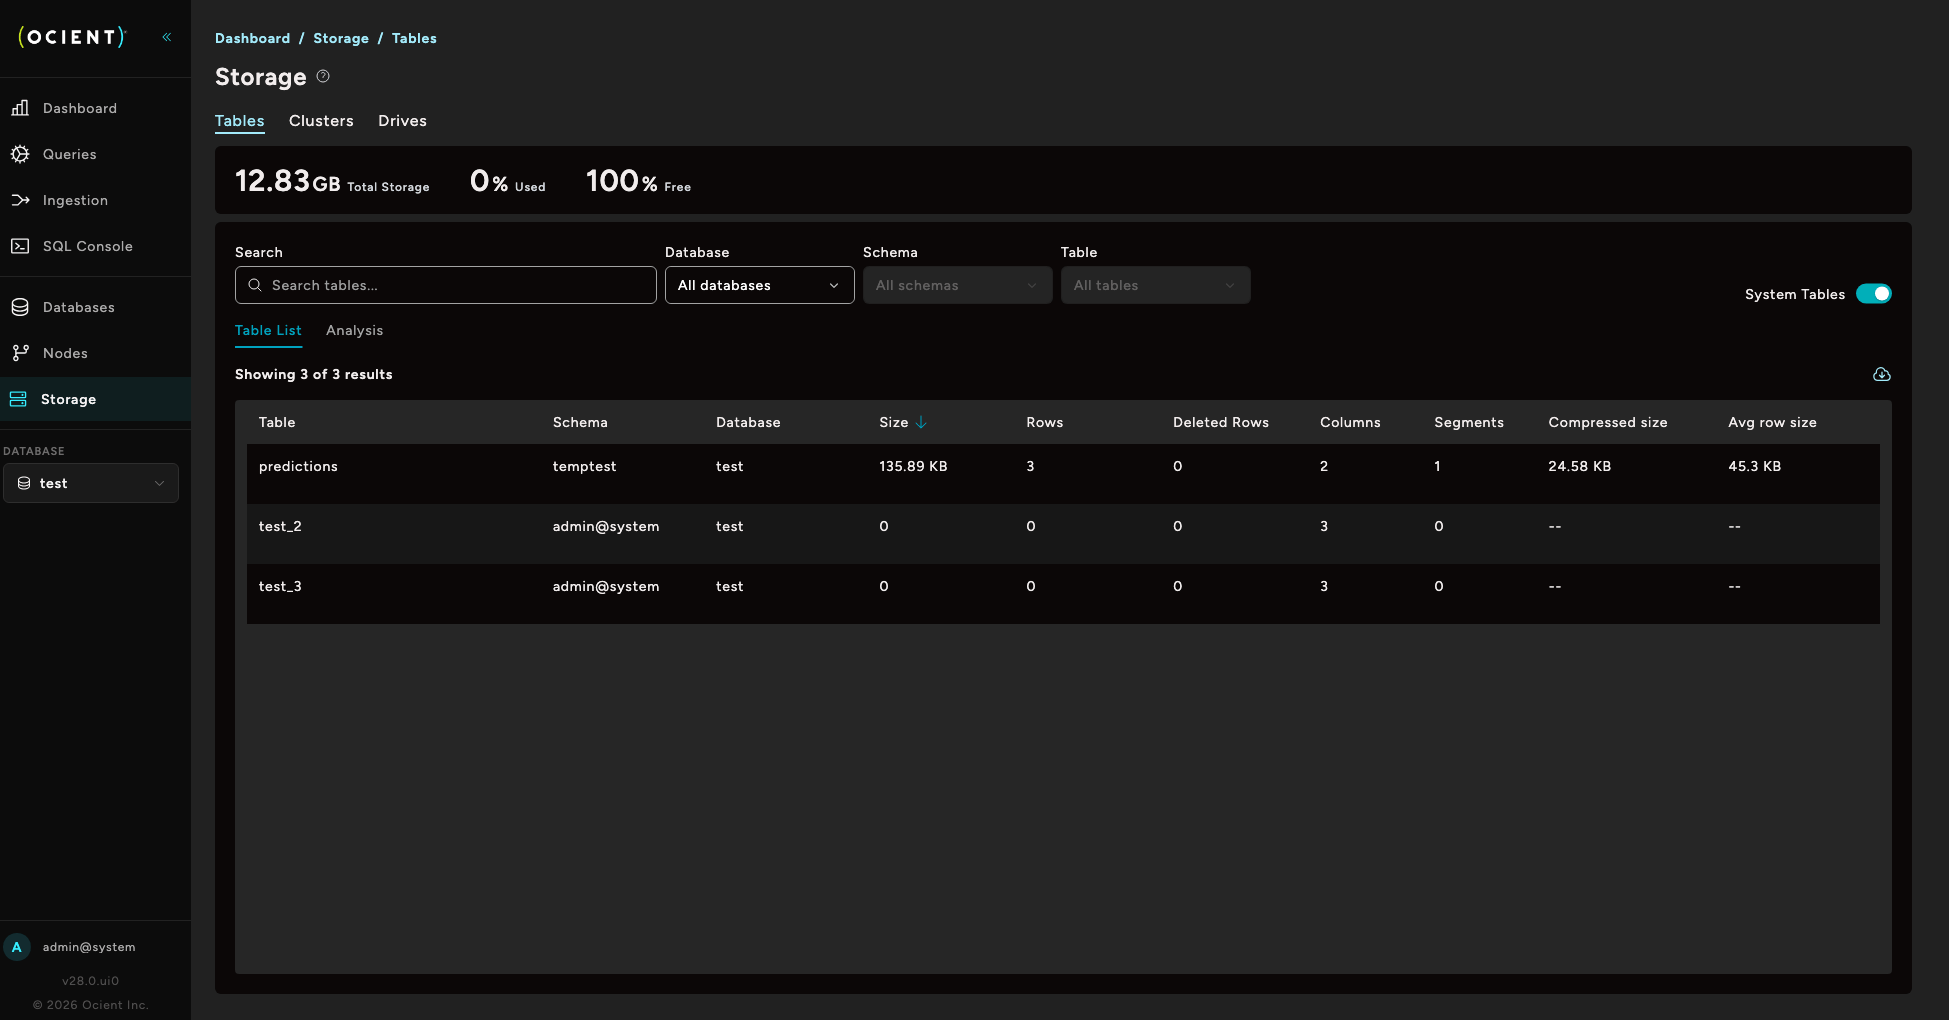
The Storage page provides visibility into the physical storage utilization of the system in these tabs:- Tables — Lists each table with its schema, database, size, row count, deleted rows, columns, segments, compressed size, and average row size.
- Clusters — Shows storage cluster details.
- Drives — Shows individual drive status and utilization.